Using data streamed from the monitoring program, the dashboard displays real-time values on
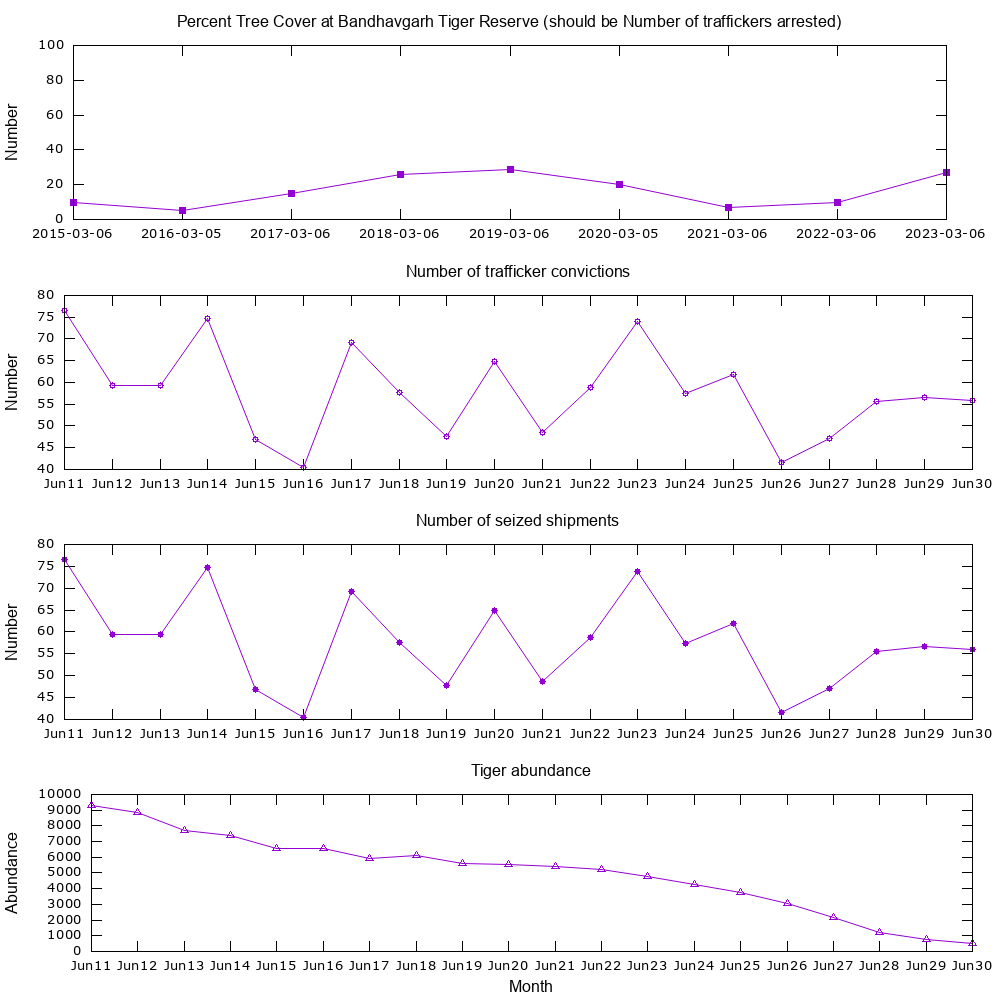
The dashboard consists of four time series plots laid out vertically
in the above order.
The JavaFX code that downloads the needed data along with the
script that creates this dashboard is
here.
The dashboard generated by these two programs is:
For purposes of development, the JavaFX program, Inteldash.java queries the Oak Ridge National Laboratory Web Service API for Percent_Tree_Cover observations taken yearly from 2015 through 2023 at the Bandhavgarh Tiger Reserve, India. This is accomplished with three separate queries:
This Percent_Tree_Cover variable replaces the number-of-trafficker-arrests variable simply to show how the provided JavaFX program, Inteldash.java can be used to automatically download data from the web at regular time points. As discussed in Monitoring Program, in actual application, the firm's liaison consultant for this biodiversity project (see Cogent Social Sciences 2022) would work with South Africa's Ministry of the Environment to set up a web service to provide a real-time, API-accessible interface to such number-of-trafficker-arrests data.
The dashboard's graphics are generated with the gnuplotTM (see gnuplot at sourceforge) script, inteldashgraphs.gp that reads data downloaded by the JavaFX program, Inteldash.java. This script is re-run every 24 hours by a call from Inteldash.java. This gnuplot script creates inteldashgraphs.png. This image file is in-turn, displayed in a customer's browser by an HTML file such as the one you are presently reading: inteldashboard.html.
There are two advantages to this procedure for updating the dashboard. First, all computations are performed on the firm's server with only the final rendering of the dashboard performed client-side. Second, dashboard graphics are created by gnuplot -- a free software package that has extensive capabilities.